Quality Control
From the beginning of the modern era, quality control has been an ongoing focus of the natural gas industry. Specifications and requirements have been established, altered and redefined many times over the years, but the goals have always been the same – to ensure the calorific content of the gas, the dryness of the gas, that pipelines and equipment are protected from aggressive gases, and that the components in the gas stay in the gaseous state from well head to end-user.
With regard to this last point, the main focus has mostly been on ensuring that no liquid water is present. One way to monitor this is to measure the water dew point (WDP) of the gas. This provides two important pieces of information:
· At what temperature will there be liquid water in the pipeline.
· The WDP provides information about the overall amount of moisture in the gas.
More recently the gas industry has established requirements for the hydrocarbon condensation temperature or ‘hydrocarbon dew point’ (HCDP) of natural gas. This measurement has become much more important as the gas transport infrastructure expands to mix and deliver gas from many sources to a global market. As these different gas matrices mix, the phase state behaviour of the gas changes in ways that are not predicable. Since it is crucial that the gas remains in a single state in the pipeline, continuous monitoring of the HCDP is required in order to combat the effects of this unpredictability.
When measuring the HCDP, there are two main issues to be resolved.
The first issue has to do with the sensitivity of the HCDP analyser to trace amounts of heavier hydrocarbons (C11+) in the gas. This has been illustrated in Figure 1.
The presence of elevated levels of these trace components leads to significant differences between the HCDP readings, i.e. the temperature at which the first hydrocarbon molecule precipitates onto the chilled mirror, and the amount of potential hydrocarbon liquids (PHLs) that may precipitate out, creating problems for process equipment. The graphs in Figures 1 and 2 illustrate this issue.
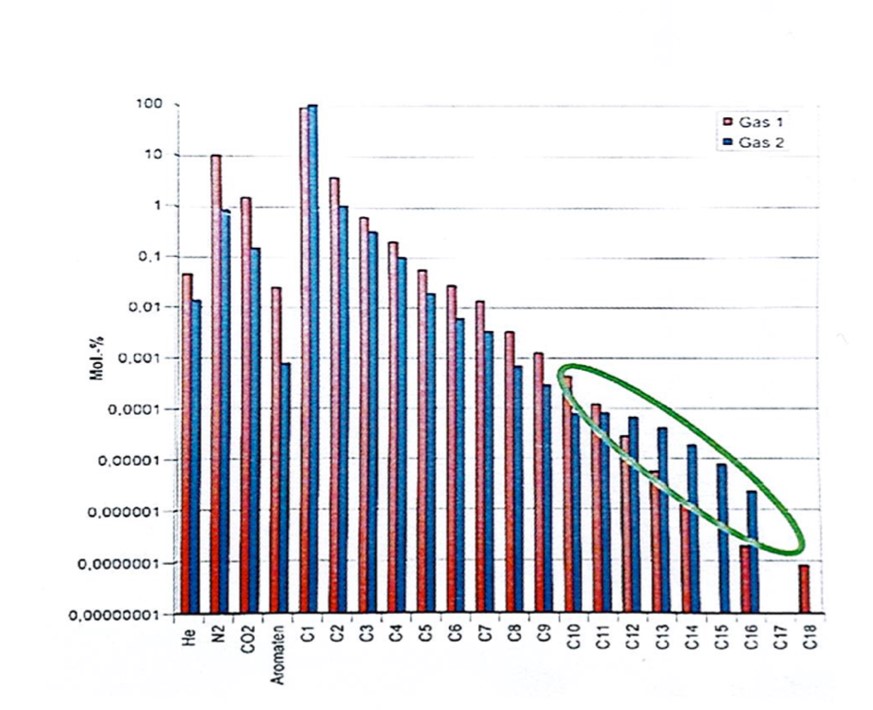
Figure 1. A comparison of natural gas produced by two conensate fields in terms of the respective component compositions
Figure 1 presents a chromatographic analysis of two gases with different compositions:
· Gas 1 (red) contains the higher percentage of hydrocarbons in the C2 – C10 group.
· Gas 2 (blue) has a comparatively higher percentage of hydrocarbons in the C12 – C16 group.
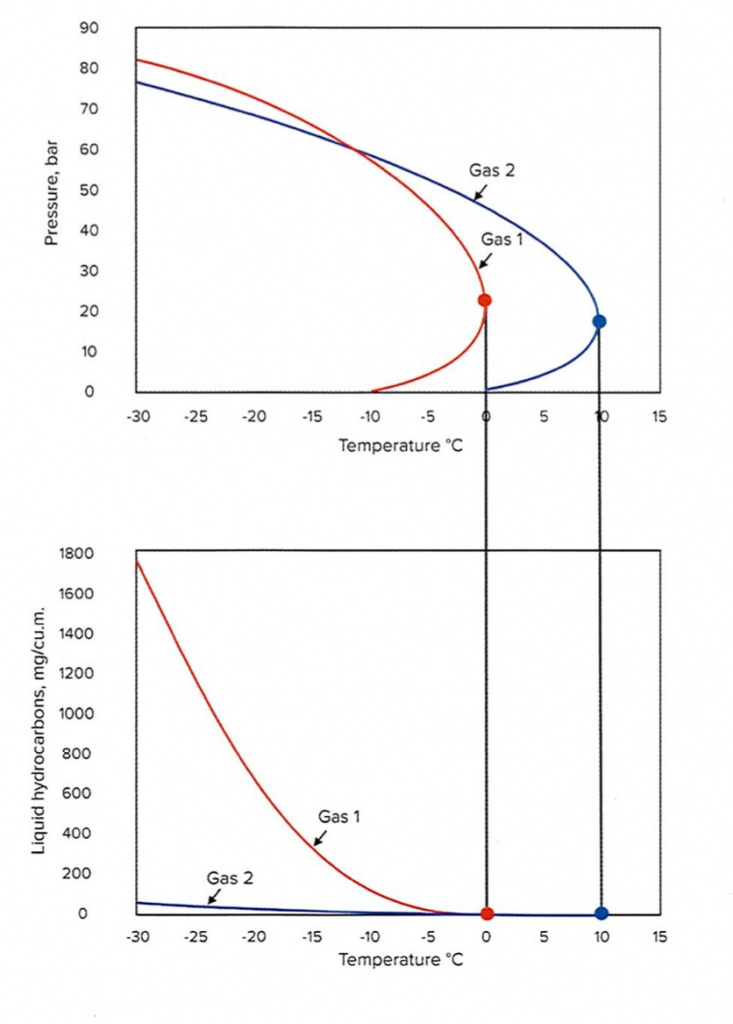
Figure 2. Graphs illustrating the condensation temperature curves and temperature-dependent condensation amount curves for natural gas
Figure 2 shows that at the respective cricondentherms (the maximum HCDP temperature for a given gas), the phase states of the gases differ by more than 10 °C, but the probability of liquid phase precipitation for the gas plotted in blue is virtually zero, even when the gas is supercooled to -30 °C.
In practice, the HCDP only provides information regarding whether there are condensates present at a given temperature and pressure. The HCDP does not give any information about how much condensate is formed relative to pressure, temperature, and composition.
The preferred approach for finding the amount of condensate relative to these parameters is to measure the potential hydrocarbon liquid content (PHLC) of the gas. This is defined as the amount of condensed liquid present at a certain pressure and temperature (in mg per unit volume of gas). This approach has been adopted by many European gas companies. The procedure for measuring the PHLC is defined in the standard: ISO 6570:2001 “Natural gas. Determination of potential hydrocarbon liquid content. Gravimetric methods.”1
The second issue is associated with the metrological reference for HCDP analysers. Currently, it is common for these analysers to be calibrated using propane. But this presents a problem as condensation hygrometers of different manufacturers have significantly different technical characteristics that affect measurement results.
Calibration of condensation hygrometers using propane
To date, there is no single official calibration method for HCDP analysers. It has simply been common practice to employ a method using propane as the calibration gas, based on tables of data listing the propane condensation temperature at specific pressures.
The basic procedure for this method involves delivering highly pure propane to an analyser at a set pressure that is being monitored using a high-precision manometer. By setting the pressure to various values and using the information listed in the table, it is possible to confirm or adjust a condensation hygrometer to accurately report the HCDP for propane in a given measurement range.
The issue, however, is that calibration or verification using propane virtually removes any discrepancies in the sensitivity of analysers from different companies.
For example, at 0 °C, propane condenses with a vapour content of 10,340 g/m3 , whereas octane condenses with a vapour content of 1,491 g/m3. Therefore, at a temperature of 0 °C, almost 7000 times more propane condensate is deposited on the chilled mirror of a condensation hygrometer than octane condensate. What this comparison reveals, is that almost any registration system used in a condensation hygrometer can easily mark the moment of propane condensation. Unfortunately, propane is not a good analogue for natural gas.
In natural gas, it is extremely rare for propane to condense in the relevant temperature range of -30 °C – +10 °C in metrologically significant amounts (the exception is associated gases with a relatively low percentage of methane). As a rule, heavier hydrocarbons – decanes, octanes, and heptanes with much lower concentrations than propane – condense out of the gas onto the chilled mirror in the temperature range of -20 °C – +10 °C in amounts that are more relevant.
Figure 3 and Table 1 show the condensation temperatures of decane, octane, and heptane, as well as the corresponding amount of condensation. This demonstrates that decane can condense in very low concentrations, whereas heptane condenses in concentrations more than 20 times higher. A chilled-mirror hygrometer requires an optical system sensitive enough to register the presence of decane condensation on the mirror.
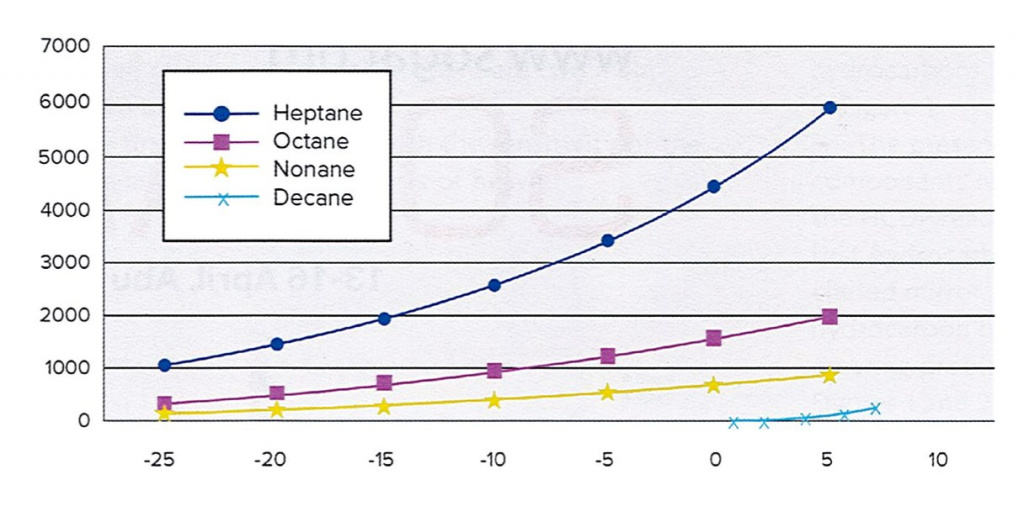
Figure 3. Amount of condensation of heavier hydrocarbons at different temperatures.
Developments within Europe
An additional complication is that natural gas from different sources has different compositions, and it is virtually impossible to predict the hydrocarbon condensation behaviour in real time. However, when measuring the HCDP of real natural gases, a factory calibration using propane results in differences in the values reported by hygrometers of various manufacturers that are often unacceptably large, although these differences are also not predictable.
Figure 4 shows the measurement results of four analysers (from various manufacturers) for changing natural gas compositions. While the measurement results for the first gas are quite similar, for the second gas the discrepancies exceed acceptable limits. In the case of the third gas, the situation is even more extreme as the difference between reported values exceeds 25 °C.
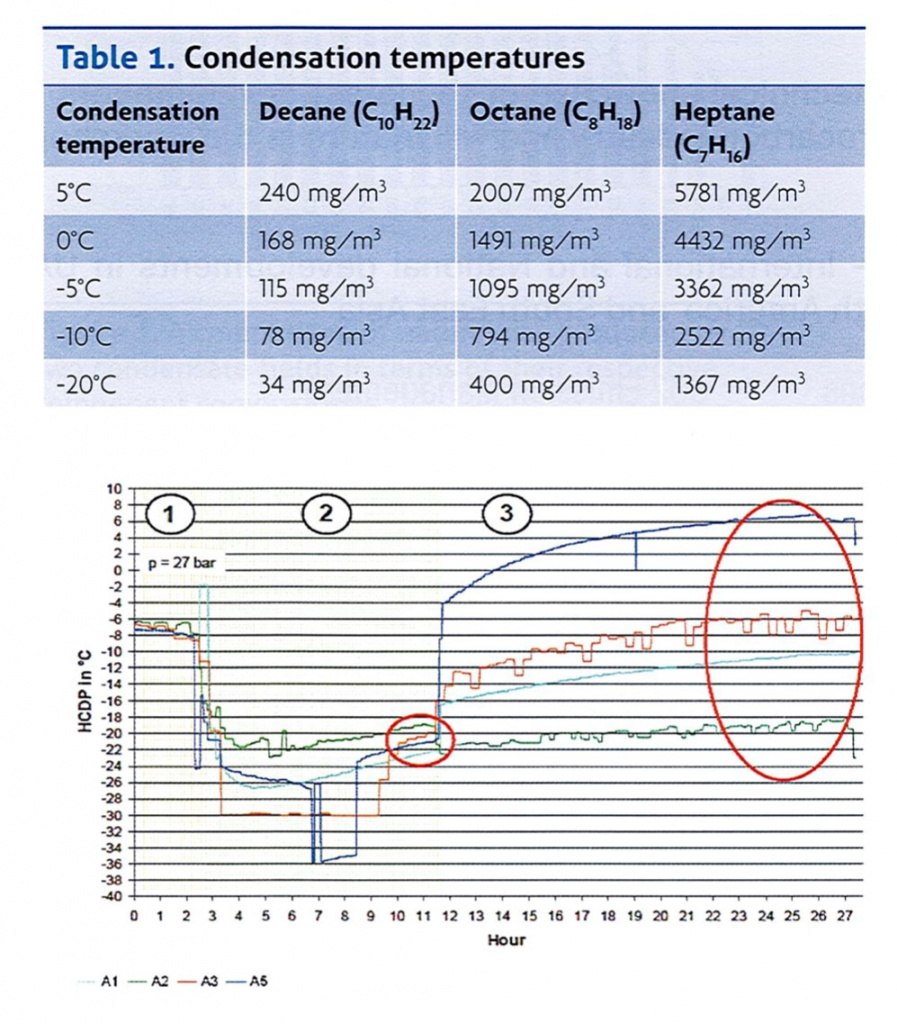
Figure 4. Measurement results for the hydrocarbon dew point using hygrometers from different manufacturers (A1, A2, A3, A5), for natural gases with different compositions (1, 2, and 3).
To solve this problem, the European Gas Research Group (GERG) launched the GERG project PC1/1.64: “Installation, calibration and validation guidelines for online hydrocarbon dew point analysers.”
This work was carried out under the supervision of the Open Grid Europe (OGE) laboratory on behalf of the German E.ON Ruhrgas AG.
Testing of various HCDP analysers measuring low calorific gas (L-gas) with hydrocarbons of the C12 – C16 group resulted in an average difference between measured values exceeding 15 K.
This discrepancy is due to differences in the amount of condensate that is necessary in order for it to be registered by the various optical systems.
However, the GERG project also demonstrated that there is a direct relationship between the HCDP and the PHLC. Therefore, PHLC measurements of the test gases were carried out using the gravimetric method in accordance with ISO 6570:2001 and ISO/TR 12148:2009. Based on these measurements, a standardized analyser detection point was established that corresponds to registering 5 mg/m3 of hydrocarbon condensates on the chilled mirror. The temperature at which this amount of condensate has accumulated was considered to be the HCDP, and the basis for calibrating analysers of any configuration.
Measurements made using the same analysers as before, but calibrated to the 5mg/m3 standard, resulted in an average difference in reported HCDP values for low calorific gas of less than 3 K. Over a four-week period, tests using other gases with significantly different compositions demonstrated that measurement results between instruments calibrated using the 5mg/m3 method were essentially unaffected by fluctuations in gas composition.
Accordingly, calibrating HCDP analysers based on PHLC solves the problem of unacceptable discrepancies between instruments – regardless of composition.
The PHLC measurement is currently a European recommendation; however, some gas companies in Europe have already implemented it as the standard. In the near future, the temperature corresponding to a PHLC of 5mg/m3 may increasingly replace measurement of the traditional HCDP.
Laser-interferometric method for determining the PHLC of natural gas
If the 5 mg/m3 calibration method is a superior paradigm, it may be asked, why this method is not the standard practice already. The answer largely has to do with cost and convenience. To implement the 5mg/m3 standard it is necessary to have a gravimetric analysis of the calibration gas, whether pipeline gas on site or specially prepared gas in a calibration laboratory. Compared to the availability of propane worldwide and the relatively inexpensive calibration procedure associated with it, calibration to the 5mg/m3 standard is too expensive and too time consuming.
To date, in Europe there is only one gravimetric system available for field applications. The system was developed to provide onsite gravimetric analysis of pipeline gas in order to provide both a calibration standard for online HCDP analysers and a metrologically more robust confirmation of the gas quality. However, the unit is large and exceedingly expensive. These factors mean that it is not a viable alternative to traditional online HCDP analysers.
Nevertheless, very recently a promising alternative method for determining the PHLC in natural gas has been developed that uses laser-interferometric registration technology to make a volumetric measurement of hydrocarbon condensates on the surface of a chilled mirror.4
This laser-based interferometric analysis was originally developed by the SPA Vympel Co. as a means of directly registering the presence of hydrocarbon condensates on the chilled mirror in a HCDP analyser. But this technology allows the analyser to not only register the presence of a condensate film on the mirror’s surface, but also to measure the thickness of a hydrocarbon film when it is equal to or greater than 10 nm, and has been used in the CONG Prima and Hygrovision series hygrometers.
Because of this ability to measure film thickness, it was realized that this technology held promise for additional functionality. After several years of development, the CONG Prima-10C hydrocarbon liquid content analyser was developed to directly measure the PHLC in natural gas.
The analyser shown in Figure 5 measures the mass concentration of potential hydrocarbon liquid content in natural gas in the range from 1 to 100mg/m3.
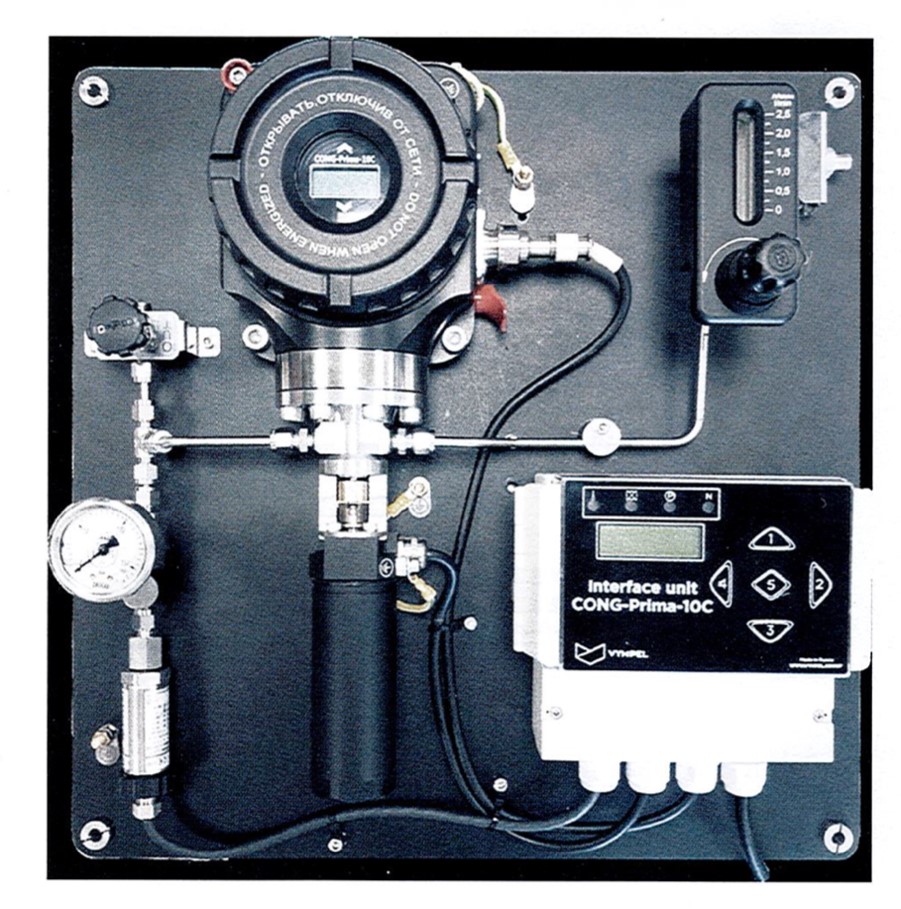
Figure 5. CONG Prima-10C mass concentration analyzer for PHLCs in natural gas.
The analyser is equipped with an automated rotary device that seals a sample volume of the test gas in the measurement chamber. When open, this space is continuously purged by flowing gas (Figure 6, left image). With the rotary device is in the sealed position, the sample gas continues to flow through the analyser’s internal tubing, but bypassing the measurement chamber (Figure 6, right image).
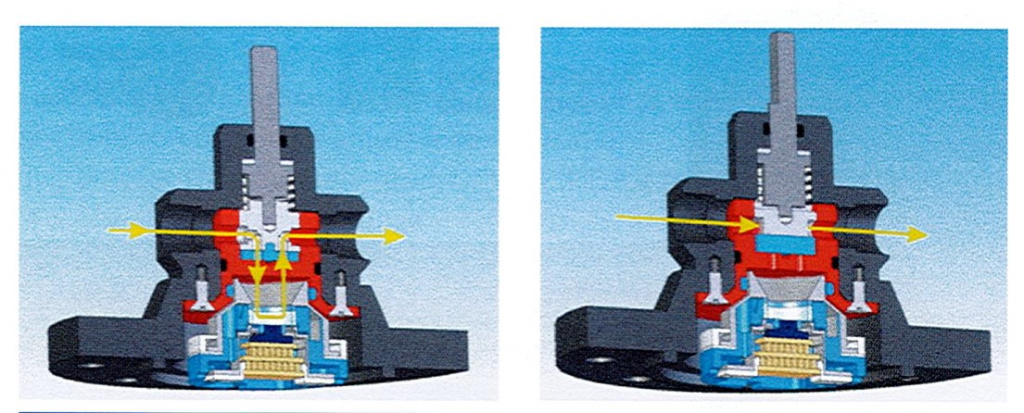
Figure 6. An illustration of the sample gas flow through the CONG Prima-10C mass concentration analyzer’s measuring chamber: in the purge mode between measurements (left) and in the bypass mode during measurement (right).
When the rotary device is in the closed position, the chamber is cooled and liquid hydrocarbons condense from the known volume of gas in this sealed space.
The measuring chamber volume and the condensation surface cooling rate are selected in such a way as to guarantee almost complete thermodynamic equilibrium between the gas and the liquid phases in the analyser chamber.
The hydrocarbon condensate mass (m) is calculated using the formula:
m=S•h•ρ
(1)
Where:
· h is the thickness of the hydrocarbon liquid film formed on the condensation surface (measured using the laser-based interferometric method).
· S is the surface area of the analyser’s chilled mirror.
· ρ is the hydrocarbon condensate average density (adopted as equal to 700 kg/ m3).
The mass concentration W of potential hydrocarbon liquid condensates in natural gas is calculated using the formula (in mg/m3):
W = m/Vk
(2)
Where:
· m is the mass of hydrocarbon condensate, as determined using formula (1).
· Vk is the volume of the measurement chamber.
The operational algorithm of the analyser incorporates a preliminary measurement of the hydrocarbon condensation temperature of the sample gas. Then, after closing the measurement chamber volume, the sample gas within is cooled at a set rate. In this mode, the analyser’s optical recording system records the temperature values and displays them on the screen of the control computer. These temperatures correspond to specific values for the PHLC in a given measurement range.
By setting the appropriate pressure using a pressure reduction valve, it is possible to obtain the PHLC value at a given temperature.
The standard measurement method implemented in the CONG Prima-10C provides inverse information compared to the gravimetric method described in
ISO 6570:2001. The analyser measures the temperature for a given amount of PHLC instead of measuring the amount of PHLC at a given temperature as described in ISO 6570:2001. However, the analyser’s operational algorithm is easily reprogrammed to measure the hydrocarbon condensate film thickness at a given temperature. In this mode, it is possible to implement a method for measuring the PHLC that is similar to that described in the international standard ISO 6570:2001.
Metrological support for measurement of the potential hydrocarbon liquid content
In order to validate the metrological characteristics of PHLC analysers during testing, verification, and calibration, it is optimal to use ‘standard samples’ of artificially prepared gas mixtures that are certified for a specific PHLC value.
Standard samples are certified in accordance with ISO 6570:2001 (method A: a gravimetric method of manual weighing of the condensate). The first experimental studies using standard samples certified for the PHLC value were carried out in consultation with the Federal State authority ‘D.I. Mendeleev All-Russian Research Institute of Metrology’, which confirmed the plausibility of this approach. As the test medium, standard samples of a gas mixture are composed to simulate main pipeline natural gas of various compositions as well as binary gas mixtures. The difference in PHLC measurement results of a set of standard samples using the CONG Prima-10C compared to the measurement values obtained by the gravimetric method, as per ISO 6570:2001, were within the range of ±1 K.
Conclusion
Measurement of the hydrocarbon condensation temperature (HCDP) does not provide objective information about the actual risk of liquid phase formation in the pipeline. It can only offer information about the potential for a hazardous situation. There is also a need to obtain specific information about the temperature at which a relevant amount of hydrocarbon condensates (PHLC) will be present in the pipeline.
The newly developed application for existing laser- based interferometric analysis technology can provide the required information about the PHLC in a continuous, automated and reliable manner. The new generation of analysers that use laser-based interferometric technology to measure the PHLC are similar in size to traditional HCDP analysers. This technology has been designed to improve the monitoring of gas quality and hydrocarbon condensation behaviour.
References:
1. ‘Natural gas. Determination of potential hydrocarbon liquid content. Gravimetric methods’, ISO 6570:2001.
2. YAWS, C. C., ‘Physical & Thermodynamic Properties – Part 24: Correlation constants for chemical compounds’, Chemical Engineering, (22 November 1976), pp. 153 – 162.
3. ‘Calibration of chilled mirror type instruments for hydrocarbon dewpoint (liquid formation)’, ISO/TR 12148:2009.
4. SELEZNEW, S. V., DEREVYAGIN, A. M., STOLYYAR, N. F., LYKOV, A. G., and ISTOMIN, V. A., ‘High-precision laser-interference method of moisture and hydrocarbons dew points measurement of natural gas’, IGRC, Paris, France, (7 - 10 October 2008).
